
Table of Contents
Intro
Decentralized finance (DeFi) has revolutionized the financial landscape, enabling users to access a wide array of financial services without the need for traditional intermediaries. Yield aggregators have emerged as a prominent component within the DeFi ecosystem, providing users with innovative solutions for maximizing returns on their crypto assets. These platforms pool funds and allocate them across various DeFi protocols, seeking to optimize yields through automated strategies. However, the inherent volatility and complex nature of the crypto markets present unique challenges and risks for yield aggregator portfolios.
This post delves into yield aggregators and the role they play in DeFi, while also presenting a robust approach for optimizing vault portfolios. Harnessing Conditional Value at Risk (CVaR) and Generalized AutoRegressive Conditional Heteroskedasticity (GARCH) simulation techniques, we explore the management of tail risk—a critical aspect of crypto market dynamics. We walk through a methodology for initial vault selection, data pre-processing, model selection, and parameter tuning, and discuss various measures for evaluating GARCH model fit.
DeFi and Yield Aggregators
Yield aggregators provide investors with a vehicle to earn high returns by automatically optimizing asset distribution among various lenders and liquidity providers. Users can deposit crypto assets in one instrument (often these are vaults which are deployed as smart contracts on a blockchain – think robo-advisors), which are then invested across other DeFi protocols.
Yield aggregators utilize various strategies, such as lending, liquidity provision, yield farming, and arbitrage to find the most profitable configuration and continuously adapt based on market conditions. Aside from the often very high returns, they also result in lower transaction costs, provide automatic rebalancing, simplify portfolio management, and allow diversification across multiple protocols and platforms.
For the larger ecosystem, the pooled user funds within yield aggregators supply liquidity to platforms, enabling larger transactions, reducing slippage, and promoting efficient price discovery.
There’s much more to Yield Aggregators and Vaults, but we won’t go into the specifics in this post, suffice to say that the often high returns come with various risks including some specific to DeFi including Smart Contract Risk (bugs, vulnerabilities in the contract code) and Impermanent Loss (when liquidity is provided to a pool on an Automatic Market Maker platform and the pool value diverges from it’s baseline).
For more on one of the more established aggregators with significant TVL (Total Value Locked – akin to AUM) – Yearn Finance, see this article.
Portfolio Optimization Approach
CVaR with GARCH Simulation
While exploring portfolio optimization for yield aggregators, we’ll adopt a CVaR (Conditional Value at Risk) approach with GARCH (Generalized Autoregressive Conditional Heteroskedasticity) simulation, as it is particularly applicable to crypto assets. The inspiration for this approach came from the April 2023 Journal of Investing article “Portfolio Optimization Techniques for Cryptocurrencies” that compares various methods for estimating distributions for asset returns, including normal, historical, and GARCH models within a CVaR setting.
Yield aggregators, like cryptocurrencies, often exhibit volatile returns and non-normal distributions, so traditional portfolio optimization approaches typically won’t capture their unique characteristics. The CVaR / GARCH approach is better suited as it accounts for the inherent volatility and tail risks often present in their return distributions.
CVaR, Crypto Markets and Tail Risk
Tail risk refers to the likelihood of severe losses in investment returns that surpass what standard distribution models predict. These losses typically arise from rare and unforeseen events that significantly impact asset prices. Conditional Value at Risk (CVaR), also known as Expected Shortfall (ES), is an essential risk measure employed for building portfolios in markets with considerable tail risk, like the cryptocurrency market.
CVaR is an all-encompassing risk metric that estimates the expected loss in worst-case scenarios, considering a specific confidence level. In contrast to the traditional Value-at-Risk (VaR) approach, CVaR accounts for both the frequency and magnitude of extreme losses, making it a more informative risk measure for the highly volatile crypto market.
For example, consider two yield aggregator portfolios with differing allocations of cryptocurrencies. Using CVaR, we can compare the potential worst-case losses across these portfolios. A portfolio with a lower overall CVaR would be preferred as it indicates a smaller expected loss in extreme situations.
Generalized AutoRegressive Conditional Heteroskedasticity (GARCH)
GARCH (Generalized Autoregressive Conditional Heteroskedasticity) models are statistical tools for analyzing time-series data with serially autocorrelated variance errors (errors that aren’t random and follow a pattern). They’re particularly useful for portfolio optimization of often volatile yield aggregators due to their ability to capture market characteristics, such as volatility clustering, time-varying volatility, and fat-tailed return distributions.
GARCH models account for volatility clustering by allowing the conditional variance to evolve over time, leading to improved risk assessments and more accurate portfolio optimization. Unlike traditional models with constant volatility assumptions, GARCH models recognize and model the changing nature of financial market volatility, which is of particular relevance to crypto markets. By capturing the time-varying nature of volatility and fat tails in return distributions, GARCH models can enable better risk management and more resilient portfolios.
Yield Aggregator / Vault Selection
In our study of yield aggregators, we selected five prominent platforms: Yearn Finance, Badger DAO, Beefy Finance, ACryptoS, and Yield Yak. These yield aggregators have gained significant attention in the DeFi ecosystem and offer various vaults (smart contracts that automate investment management) that employ different strategies to generate returns, such as liquidity provision, yield farming, and token arbitrage.
To effectively manage risk and diversify investments, we aimed to identify and allocate assets across a diverse range of yield aggregators and vaults. We reviewed twenty vaults across the yield aggregators based on several criteria, including Total Value Locked (TVL), Annual Percentage Yield (APY), time in operation (which correlates to code risk), and data availability. By considering these factors, we were able to identify vaults with promising potential in terms of returns and stability.
 | Yearn Finance is a pioneer in the yield aggregator space, offering a range of vaults that employ sophisticated strategies to maximize returns. |
 | Badger DAO is focused on accelerating the adoption of Bitcoin in DeFi and offers vaults designed to optimize returns on Bitcoin-related assets. |
 | Beefy Finance, a multi-chain yield optimizer, provides vaults across various blockchain networks, allowing for broader exposure to different DeFi ecosystems. |
 | ACryptoS is known for its stablecoin-focused vaults, catering to investors seeking lower volatility while still generating attractive yields. |
 | Yield Yak is a DeFi yield aggregator platform designed to optimize users’ returns by automatically compounding and allocating assets across various high-yield farming strategies on the Avalanche network. |
After evaluating these criteria, we employed a simple scoring approach to rank the shortlisted vaults, considering their TVL, APY, and operational history. This quantitative analysis was complemented by a qualitative review, which took into account factors such as the underlying strategies, platform reputation, and user experience.
GARCH Modeling and Optimization
Our approach started with pulling down daily APY (Annual Percentage Yield) data captured from the respective vaults, then iterating through various ARCH model and configuration permutations until models are found that look like they fit the data well. From there models were filtered that didn’t result in a good fit, followed by an investigation of additional measures of fit for the remaining models. A further round of filtering left us with a shortlist for CVaR calculations and portfolio weighting. There are obviously other, more sophisticated approaches to initial asset selection but given our initial selection criteria and wide disparity in time horizon and kurtosis extremes, this approach is a sufficient starting point.
Data Pre-Processing
Vault returns are reported as yields (APY) which fluctuate on a daily basis (or even more frequently). For processing our data sets, we set a minimum time horizon of around 300 days, which is on the lower side for GARCH modeling but given many vaults have not operated for multiple years and the DeFi space is evolving, this is a limitation we’ll be conscious of as we assess the results.
Data pre-processing itself was relatively simple and comprised resampling the APYs to daily frequency, interpolating missing values and calculating the day to day changes as percentages.
GARCH Model Selection
Model Selection and Parameter Tuning
(G)ARCH models come in many variations and can be configured across multiple model specifications. Rather than manually test for different specifications, the iterative model selection and parameter tuning process was executed by running parameter estimation across multiple specifications. Model variations were configured along:
- ARCH model type
- Distribution (Student’s t, skewed, generalized error or normal)
- Autoregressive (AR) component “p”
- Moving Average (MA) component “q”
- Exogenous (O) component – in our case, switching on the O parameter means the use of a GJR-GARCH model that allows for asymmetric effects of shocks on volatility (which, we can hypothesize, are likely to be more outsized for crypto markets than traditional markets).
For the initial assessment of model fit, we’ll utilize AIC (Akaike Information Criterion), BIC (Bayesian Information Criterion), and the BG (Breusch-Godfrey) test and build these into our model iteration code. AIC and BIC take into account both the goodness of fit of the model and the complexity of the model (i.e. the number of parameters), while the BG test can help identify potential issues with autocorrelation (meaning the errors are correlated over time which can cause bias or inefficient estimates).
Below are the best performing model configurations for each of the shortlisted vaults. Vaults where we weren’t able to achieve a good fit were filtered out. Looking at the results, we were able to find models with good fit based on our first set of criteria – but we will need to take a closer look at beefy BIFI, with it’s lower p-value (as volatility dynamics may not be fully captured).
It’s also interesting to see that all vaults except beefy-FUSDT-WBTC-ETH and badger-GRAVIAURA have the strongest fit with GJR-GARCH models. GJR-GARCH suggests asymmetric volatility dynamics which implies the presence of a leverage effect (i.e. price drops have a greater impact on price) – this could relate to the FUD (Fear Uncertainty and Doubt) phenomenon which is well known in crypto markets (negative news causing significant price drops).
But overall, the lack of constant mean and the heavy-tailed distributions found in all analyzed vault assets (with additional context derived from reviewing arch model fit output) indicate that extreme price movements occur more frequently than expected under a standard normal distribution. These are significant observations and highlight the necessity of considering these extreme events when modeling and forecasting crypto vault volatility (further validating our model selections for these assets).

Model Diagnostics
Additional tests for model fit were employed allowing us to further analyze autocorrelation and heteroskedasicity.
Autocorrelation
Ljung-Box Test
This statistical test was employed to check for the presence of autocorrelation in the standardized residuals of the GARCH model. Autocorrelation can indicate that the model is not capturing all relevant information in the data, which may affect the accuracy of the forecasts. As is seen below, for all periods the test statistic was above the significance level of 0.05, except only at the lower lags (in red) for beefy-FUSDT-WBTC-ETH.

ACF Plots
An ACF plot displays autocorrelation of residuals in a time series, testing for serial correlation, which indicates if a model captures the data’s underlying structure. Ideally, residuals should be uncorrelated and resemble white noise.
The blue shaded area on the ACF plot represents the 95% confidence interval, within which autocorrelation coefficients should fall if residuals are uncorrelated. All assets (for brevity, only beefy-BIFI is shown) fit within this area which show no significant autocorrelation and suggests well-fitted models with valid predictions and inferences.

Heteroskedasticity
Residuals and Standardized Residuals
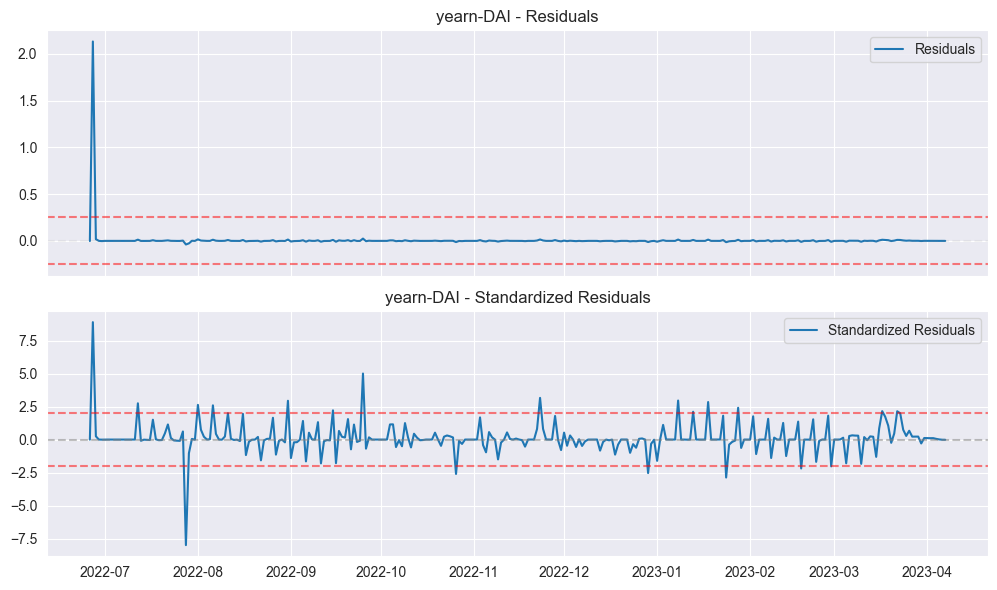
A well-fitted model should have flat residuals (indicating an effective capture of the data’s underlying structure and patterns) without discernible patterns and standardized residuals resembling white noise, between -2 and +2 standard deviations (red dotted lines below), also lacking noticeable patterns.
Only yearn-DAI is shown below (for brevity). But in this sample, while the residuals depict an overall good fit, we can see a spike at the beginning of the plot which does point to an outlier event – a spike in YFI (Yearn Finance’s token) – https://www.thecoinrepublic.com/2022/06/26/yearn-finance-yfi-token-spikes-100/ This observation is also present in the yearn-USDC vault data.
We also see another outlier around late July. On further investigation we see that vaults that manage stablecoins (tokens pegged to a currency, in this case USD) such as yearn DAI and yearn USDC all saw significant APY drops on July 27th 2022, which is the same day the Federal Reserve increased interest rates by 75 basis points.
Combining The Measures Together
To ensure a well-fitted GARCH model, it is essential to analyze residual and standardized residual plots, AIC and BIC values, and perform diagnostic tests such as Ljung-Box and ACF scores. A good model fit is identified by flat residual plots, minimal spikes in the standardized residual plot, and low AIC and BIC values. Based on our model evaluations we find no evidence of overfitting and resultant models that show no significant heteroskedasticity, Ljung-Box scores above 0.05, ACF scores within confidence levels, low AIC and BIC scores, and standardized residuals that resemble white noise. From these evaluations we can conclude that the models capture the volatility structure in the data.
CVaR Optimization and Portfolio Weighting
Once the GARCH models are fitted, they are used to simulate future changes in annual percentage yield (APY) over a specified time horizon. This generates a large number of potential future scenarios, creating a comprehensive set of simulated returns for each yield aggregator.
CVaR optimization allows us to manage risk in our portfolio of vaults, by minimizing the expected loss in worst-case scenarios while achieving the desired return on investment. Given we’re optimizing for a volatile crypto market with commensurate high returns, we have an expectation of higher risk. In order to maximize our likelihood of capturing this upside, we used an alpha of 0.1 in the optimization, which means the expected loss beyond the 10% worst-case scenario is 10% of the portfolio’s value.
We take the simulated returns from the GARCH models and compute the CVaR values for each vault. The GARCH-generated risk estimates (CVaR values) are combined with historical mean returns to find an optimal allocation that balances risk and return objectives.
Target Return and the Trade-off between Risk and Return
An additional parameter to tune was the target return, which represents the desired average yearly return on the portfolio. When the target return is increased, the optimization algorithm seeks an asset allocation that meets this higher return requirement. This typically involves allocating more weight to assets with higher expected returns, which also tend to have higher risk or volatility. As a result, the portfolio becomes less diversified, exposing the investor to higher risk. To resolve this issue, an additional constraint was added to the minimize function to maximize the weight allocated to a single vault.
Other minimize function parameters experimented with were testing with different optimization algorithms such as SLSQP, trust-region and Nelder-Mead. Convergence tolerances and maximum iterations were also adjusted, allowing for a more comprehensive search of the optimization space to identify the best solution.
Portfolio Optimization Weights
Our final portfolio weights are shown below and highlighted in blue, along with the CVaR values for each vault. The resultant portfolio combines a diversified mix of vaults across the Yearn Finance and Badger DAO yield aggregators.
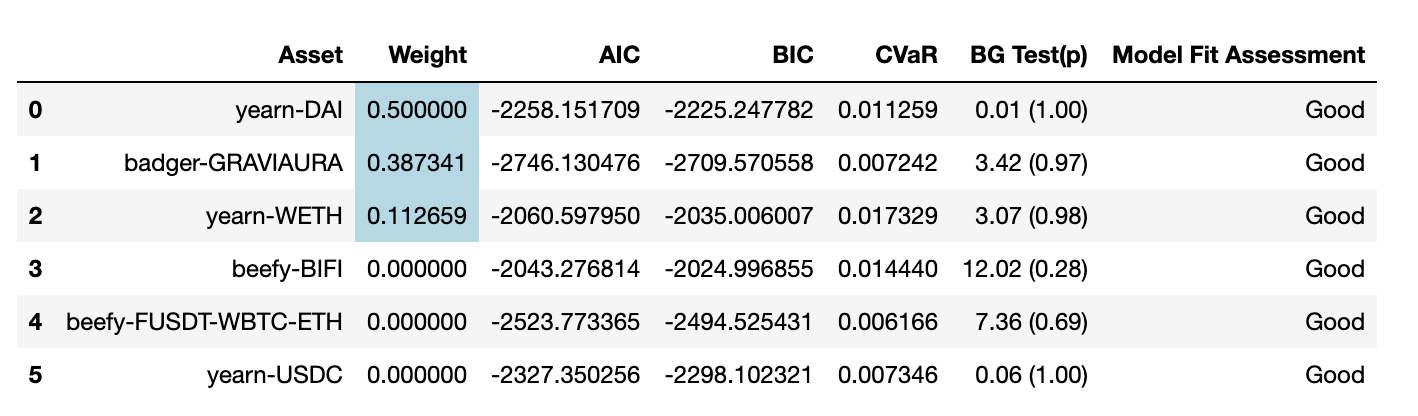
The CVaR optimization was calculated on a 90 day horizon (given the limited period of under a year’s data and also keeping in mind the volatile nature of crypto). So, to determine the overall CVaR for the portfolio over a year, assuming 365 days of trading as crypto markets never close and using the square root of time rule, the expected shortfall on our portfolio is 8.83585%, so $883.59 on a $10,000 investment. But, given the nature of crypto markets, we would re-evaluate and rebalance the portfolio on a far more regular basis than if we were to project for the year.
Simulated Returns
Our final step is to run Monte Carlo simulations for our given portfolio of assets to estimate the future value and risk associated with the portfolio. To do this, we utilize the GARCH fit for each vault and generate simulated returns based on recent volatility and a random selection of standardized residuals. The simulated returns are then used to calculate the asset prices over the simulation period of a year. The results for a $10,000 investment are below:
Our projections posit a mean return of 42.9%, but with a significant standard deviation. The same caveats apply from the previous section on projecting out a year for yield aggregator vaults in crypto, so while the simulation is illustrative, in reality we would be monitoring the portfolio closely and likely rebalancing often to maintain our desired risk profile.
Conclusion
In this analysis, we explored the application of GARCH modeling and CVaR optimization for constructing a portfolio of DeFi yield aggregator vaults. Our methodology involved data pre-processing, model selection, parameter tuning, model diagnostics, and finally, CVaR optimization and portfolio weighting.
The results demonstrated that GARCH models, particularly GJR-GARCH, were able to capture the volatility dynamics of the vaults, and that the models passed various diagnostic tests, such as Ljung-Box and ACF tests. The CVaR optimization provided a risk-aware allocation of assets, which we used to construct a diversified portfolio that maximized return while minimizing risk.
It is important to remember that crypto markets are highly volatile, and assumptions made in our analysis may not hold true in the future. Additionally, the analysis was constrained by the limited historical data available for the vaults. In terms of implementation – the portfolio like this should be continuously monitored and the allocation potentially rebalanced often to maintain the desired risk profile.
Our study demonstrated that GARCH modeling and CVaR optimization can be effectively applied to DeFi yield aggregator vaults for portfolio construction. This approach may serve as a valuable tool for investors looking to navigate the rapidly evolving world of decentralized finance while managing risk and maximizing returns.
Disclaimer: the content in this article is not intended to be investment advice.
References
Gaskin, S., Kalim, R., Wallace, K. J., Islip, D., Kwon, R. H., & Liew, J. K-S. (2023). Portfolio optimization techniques for cryptocurrencies. The Journal of Investing, 32(3), 50-65. https://doi.org/10.3905/joi.2023.1.256
Ahelegbey, D.F., Giudici, P., Mojtahedi, F. (2022). Crypto Asset Portfolio Selection. FinTech, 1(1), 63-71. doi:10.3390/fintech1010005. https://www.mdpi.com/2674-1032/1/1/5
Palmquist, S., Mednis, J. (2022). Portfolio optimization with crypto assets: Analyzing the impact of the investors’ subjective views on portfolio risk (Master’s thesis, Umeå University, Faculty of Social Sciences, Umeå School of Business and Economics (USBE), Business Administration). http://umu.diva-portal.org/smash/get/diva2:1672778/FULLTEXT01.pdf
Cui, T., Ding, S., Jin, H., & Zhang, Y. (2022). Portfolio constructions in cryptocurrency market: A CVaR-based deep reinforcement learning approach. Economic Modelling. https://doi.org/10.1016/j.econmod.2022.106078
Naimy, V., Haddad, O., Fernández-Avilés, G., & El Khoury, R. (2021). The predictive capacity of GARCH-type models in measuring the volatility of crypto and world currencies. PLoS ONE, 16(1), e0245904. https://journals.plos.org/plosone/article/file?id=10.1371/journal.pone.0245904&type=printable
TRB. (2019, October 19). Hyper-Parameter Tuning for a GARCH-Family Vol Model. Medium. https://medium.com/@TRB/hyper-parameter-tuning-garch-family-vol-model-19-oct-2019